Best Data Visualization Tools to Buy in February 2026

Data Visualization with Microsoft Power BI: How to Design Savvy Dashboards


Good Charts Workbook: Tips, Tools, and Exercises for Making Better Data Visualizations


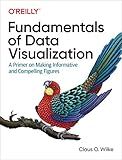
Fundamentals of Data Visualization: A Primer on Making Informative and Compelling Figures


Data Visualization with Excel Dashboards and Reports


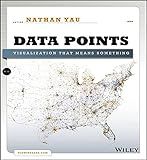
Data Points: Visualization That Means Something


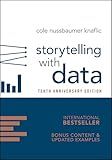
Storytelling with Data: A Data Visualization Guide for Business Professionals, 10th Anniversary Edition


Crossfilter is a powerful JavaScript library that allows you to group and filter data in real-time in D3.js visualizations. To group data using Crossfilter, you first create a Crossfilter object by passing in your data array. You can then define dimensions on the Crossfilter object based on the data properties you want to group by.
Once you have defined dimensions, you can create groups based on those dimensions to perform aggregations on the data. For example, you can create a group that counts the number of data points that fall into each group. You can also apply filters to the data using the dimensions, which allows you to dynamically update the visualizations based on user interactions.
Overall, using Crossfilter in D3.js allows you to easily group and filter data in real-time, making it a valuable tool for creating interactive and insightful visualizations.
How to create custom group functions in crossfilter in d3.js?
To create custom group functions in crossfilter in d3.js, you can define a custom reduce function that will be applied to the crossfilter group. Here is an example of how you can create a custom group function that calculates the average of a specific property in your data:
// Create a crossfilter instance var cf = crossfilter(data);
// Define a custom reduce function that calculates the average of a property function averageReduceAdd(p, v) { p.count++; p.total += v.property; p.average = p.count ? p.total / p.count : 0; return p; }
function averageReduceRemove(p, v) { p.count--; p.total -= v.property; p.average = p.count ? p.total / p.count : 0; return p; }
function averageReduceInitial() { return { count: 0, total: 0, average: 0 }; }
// Create a custom group using the defined reduce functions var customGroup = cf.dimension(function(d) { return d.category; }) .group() .reduce(averageReduceAdd, averageReduceRemove, averageReduceInitial);
// Access the average value for each category customGroup.all().forEach(function(d) { console.log("Average for category " + d.key + ": " + d.value.average); });
In this example, the averageReduceAdd function calculates the count, total, and average values for a given property in the dataset when a new data point is added. The averageReduceRemove function does the opposite when a data point is removed. The averageReduceInitial function initializes the count, total, and average values to 0.
You can customize the reduce functions to perform different calculations based on your requirements. Additionally, you can create multiple custom groups with different reduce functions to analyze different aspects of your data.
How to create groups in crossfilter in d3.js?
In D3.js, you can create groups in Crossfilter by using the group.reduce() function. This function allows you to define custom reduce functions for computing group statistics.
Here's an example of how to create a group in Crossfilter in D3.js:
- First, create a Crossfilter instance:
var cf = crossfilter(data);
- Next, create a dimension based on a specific field in your data:
var dim = cf.dimension(function(d) { return d.category; });
- Then, create a group for the dimension using the group.reduce() function:
var group = dim.group().reduce( function(p, v) { // Add logic here to compute group statistics p.count++; p.total += v.value; return p; }, function(p, v) { // Add logic here to remove data from group p.count--; p.total -= v.value; return p; }, function() { // Add logic here to initialize group return { count: 0, total: 0 }; } );
In the reduce function, the first argument represents the accumulated value (p) and the second argument represents the new value being added to the group (v). The first function is used to add data to the group, the second function is used to remove data from the group, and the third function is used to initialize the group.
You can then access the group's statistics like count or total by calling group.all():
group.all().forEach(function(d) { console.log(d.key + ": " + d.value.count + ", " + d.value.total); });
This is a basic example of creating groups in Crossfilter in D3.js. You can customize the reduce functions as needed to calculate different group statistics based on your data.
What are the advantages of using crossfilter in d3.js?
- Fast and efficient data filtering: Crossfilter allows you to quickly filter large datasets in real-time, making it easy to visualize and analyze your data without having to reload the entire dataset.
- Interactive visualizations: Crossfilter seamlessly integrates with D3.js and allows you to create interactive visualizations that respond to user interactions such as filtering, brushing, and linking.
- Multi-dimensional filtering: Crossfilter supports filtering data across multiple dimensions, enabling you to explore data from different perspectives and gain deeper insights into your dataset.
- Lightweight and easy to use: Crossfilter is a lightweight library that is easy to integrate with D3.js, making it a popular choice for creating dynamic and responsive visualizations.
- No server-side processing required: Crossfilter performs all data filtering and aggregation operations on the client-side, eliminating the need for server-side processing and reducing the load on your server.
How to retrieve data from a group in crossfilter in d3.js?
To retrieve data from a group in crossfilter in d3.js, you can use the all() method on the group object. Here is an example:
var data = [ { category: 'A', value: 10 }, { category: 'B', value: 20 }, { category: 'A', value: 15 }, { category: 'B', value: 25 } ];
var cf = crossfilter(data); var dimension = cf.dimension(function(d) { return d.category; }); var group = dimension.group().reduceSum(function(d) { return d.value; });
var result = group.all();
console.log(result);
In this example, we first create a crossfilter object cf with the input data array. We then create a dimension based on the 'category' field and a group based on the dimension and the 'value' field.
To retrieve the data from the group, we call the all() method on the group object, which returns an array of objects with the key and value pairs representing the data in the group.
You can then use this array of data to render it in your visualization using d3.js.
How to calculate counts for each group in crossfilter in d3.js?
To calculate counts for each group in Crossfilter in D3.js, you can use the dimension.group() function provided by Crossfilter to create a grouping of the data based on a specific key. Here's a step-by-step guide on how to calculate counts for each group in Crossfilter in D3.js:
- Create a Crossfilter instance and load your data into it:
var cf = crossfilter(data);
- Create a dimension based on the key you want to group by:
var dimension = cf.dimension(function(d) { return d.key; });
- Create a group based on the dimension to calculate counts for each group:
var group = dimension.group();
- Retrieve the counts for each group and process the data as needed:
group.all().forEach(function(d) { console.log("Group: " + d.key + ", Count: " + d.value); });
This will output the counts for each group in the console. You can then use this data to create visualizations or perform further analysis as needed.
Remember to include the Crossfilter library before using it in your D3.js code. Also, make sure to replace data with your actual data array and key with the key you want to group by in your dataset.
